
How to read an event's Sales and marketing report | Nevent
The Sales and marketing report brings together, on a single screen, how many orders an event generated, how much they billed and where those sales came from. This guide shows you how to read it. About 5 minutes.
Before you start
Section titled “Before you start”You need an event with recorded sales. The report uses the date range in the filters panel as purchase days: if you pick a past range, it only counts purchases made within that range.
Step 1: Open the report from the event analytics
Section titled “Step 1: Open the report from the event analytics”Go to Experiences and click your event’s name. The Analytics tab opens.
At the top right there is a dropdown with the available reports. Open it and choose Sales and marketing.
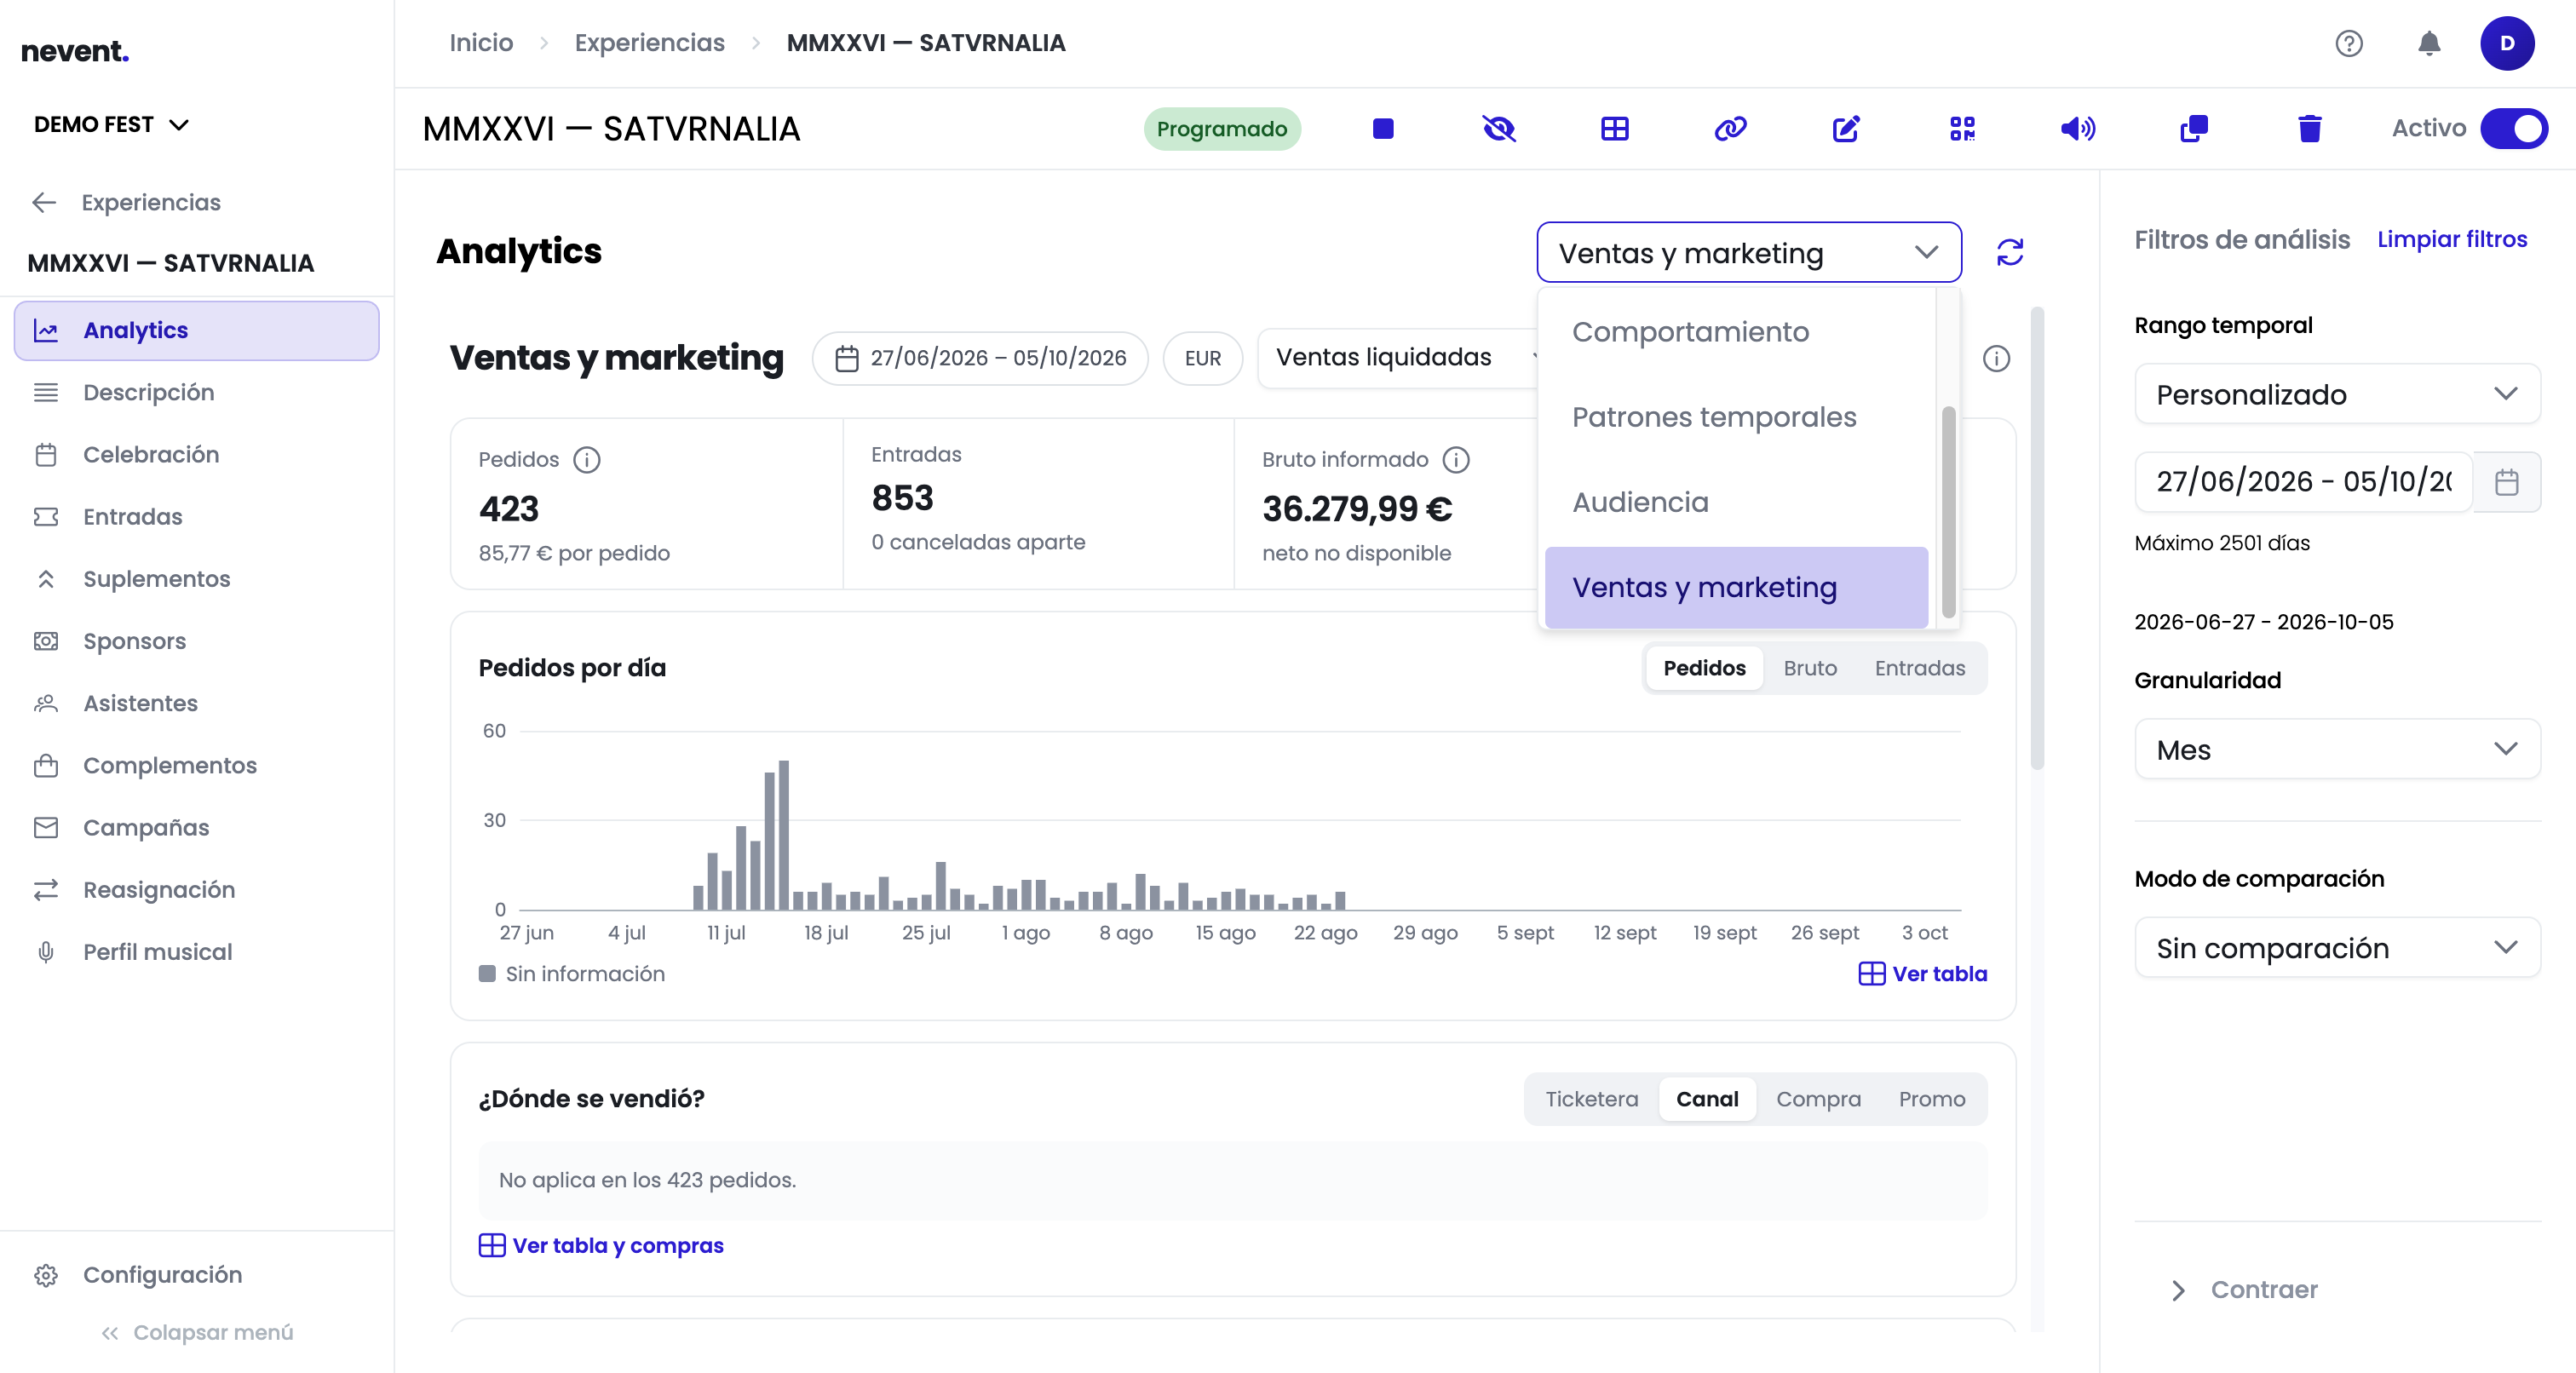
Step 2: Read the header and the four key figures
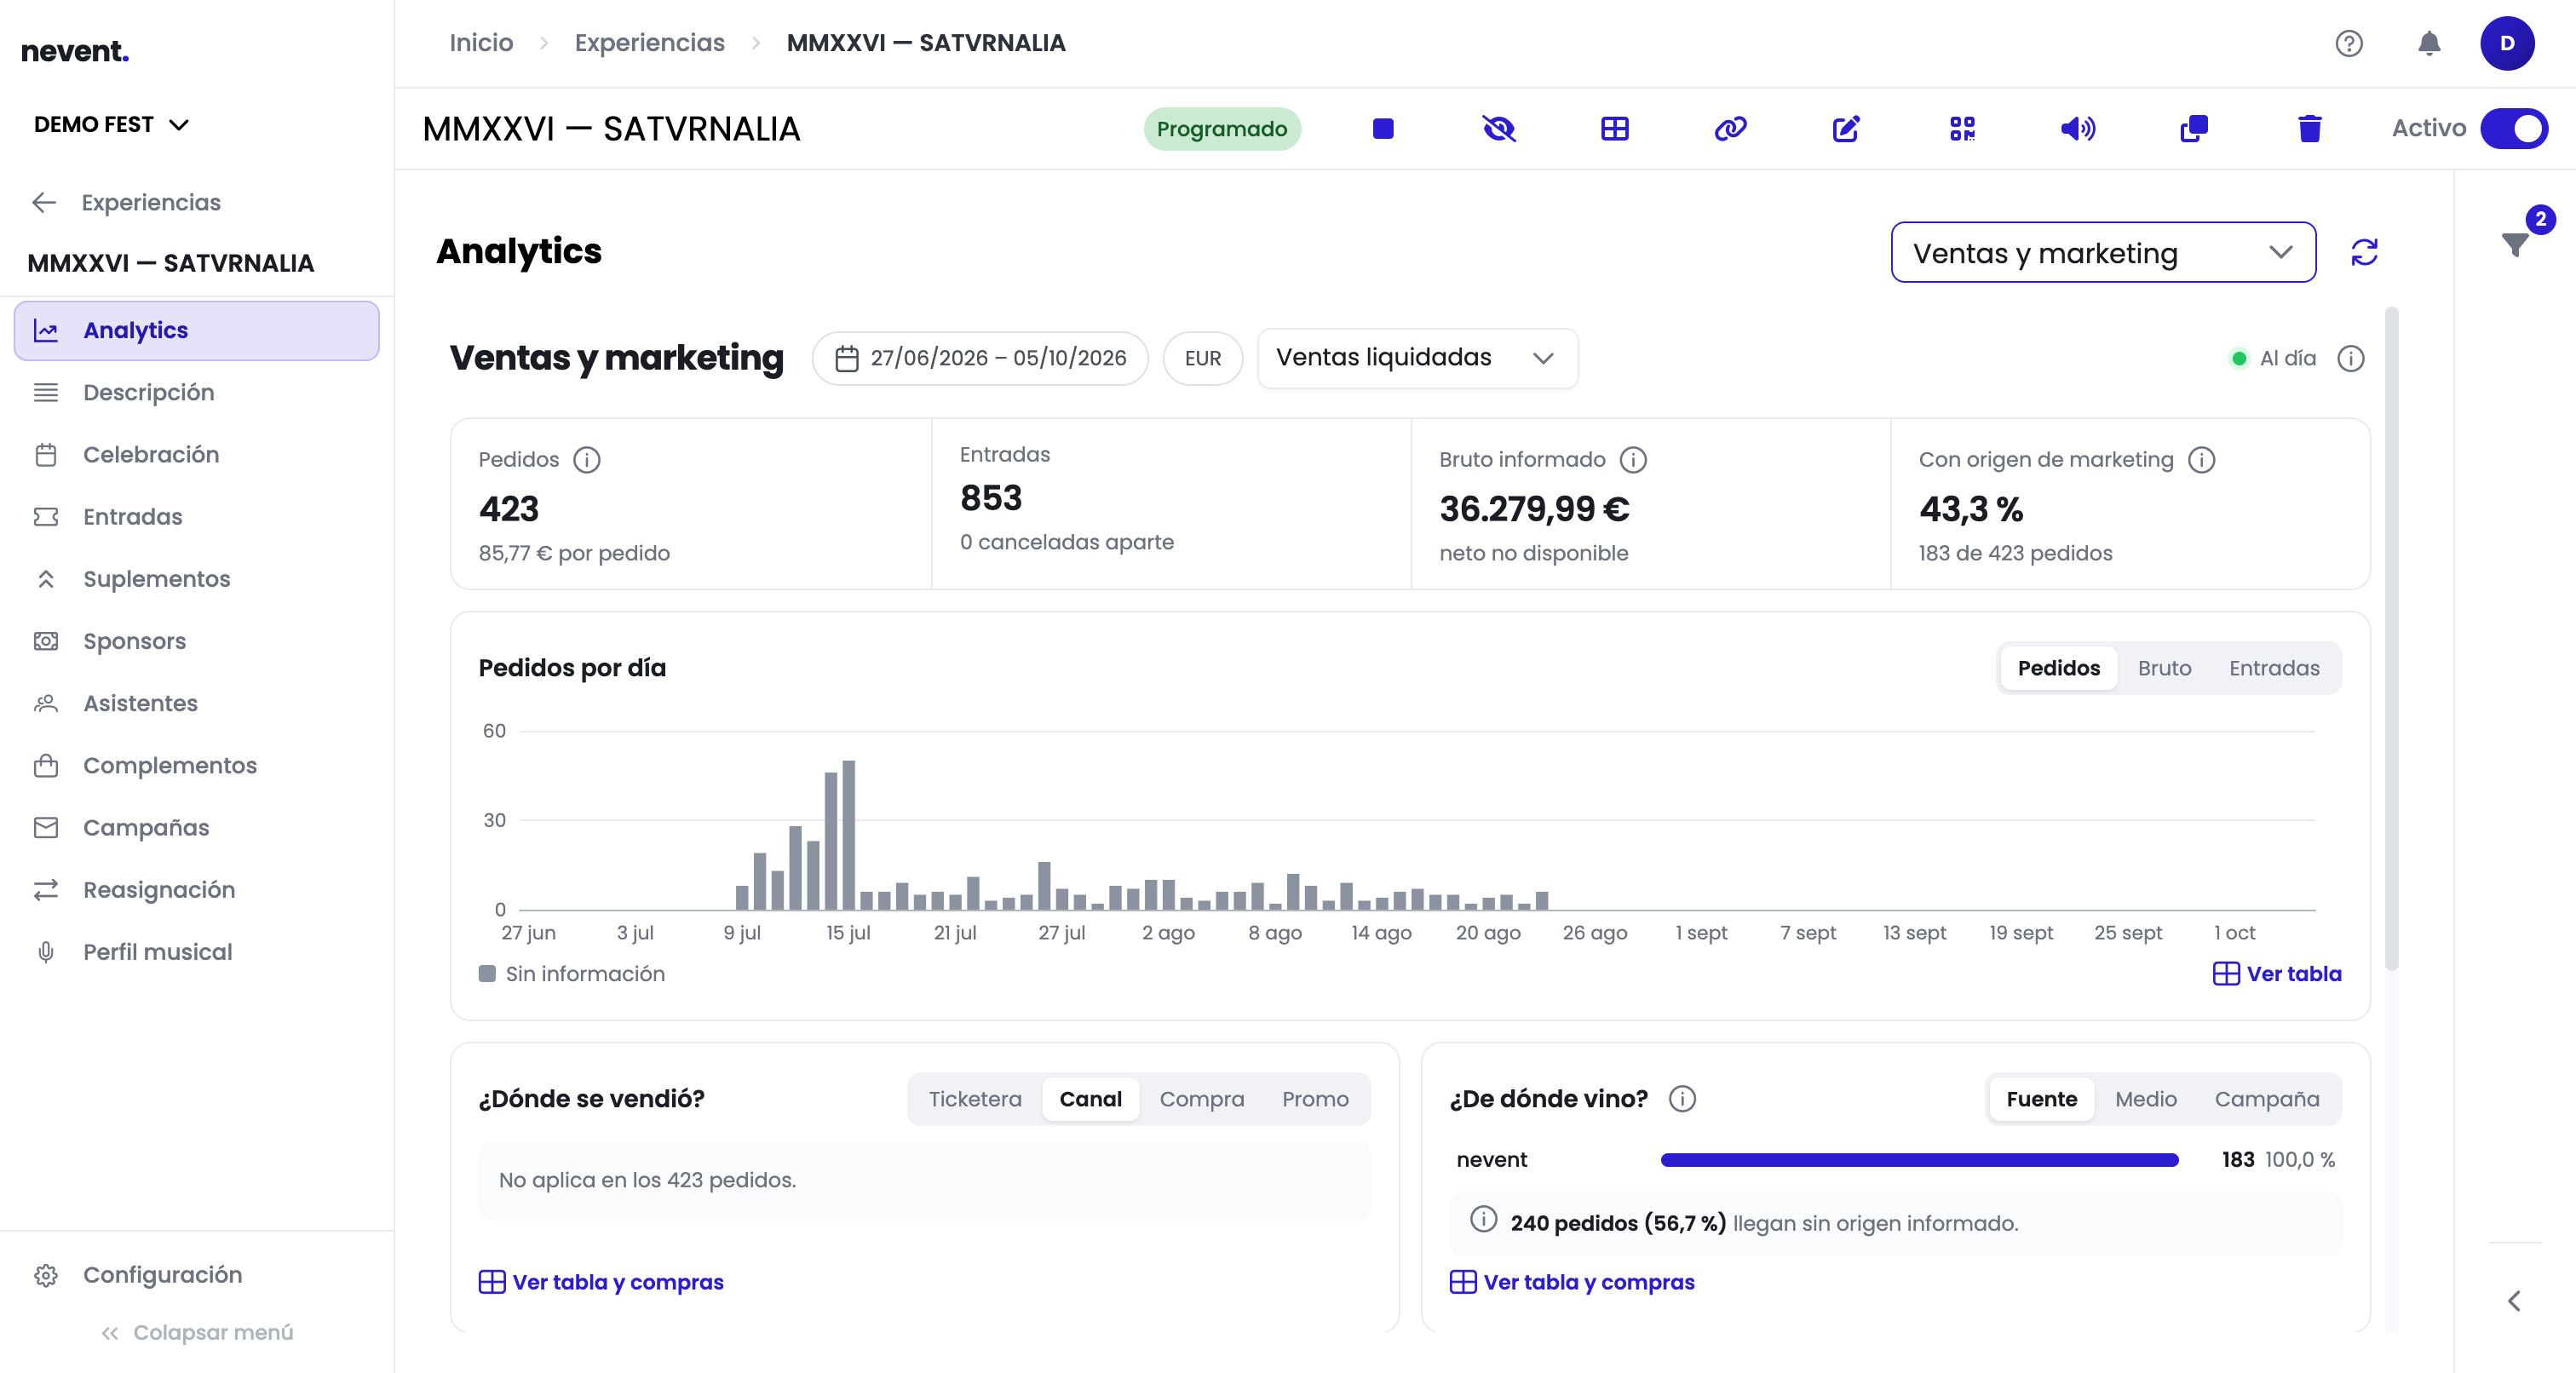
Section titled “Step 2: Read the header and the four key figures”The header tells you which data you are looking at: the purchase date range, the currency and the type of sales included. On the right, an indicator confirms whether the data is up to date.
Below it, four figures summarise the event:
| Figure | What it counts | Detail shown with it |
|---|---|---|
| Orders | Orders recorded in the range | Average gross amount per order |
| Tickets | Tickets sold | Cancelled tickets, counted separately |
| Reported gross | Reported billing, fees included | Net is not available |
| With a marketing source | Share of orders with a known source | How many orders out of the total |
Just below, Orders per day shows the daily trend. The Orders, Gross and Tickets tabs switch the magnitude of the chart without losing the range.
Step 3: Find out where each order was sold and where it came from
Section titled “Step 3: Find out where each order was sold and where it came from”Two blocks answer different questions:
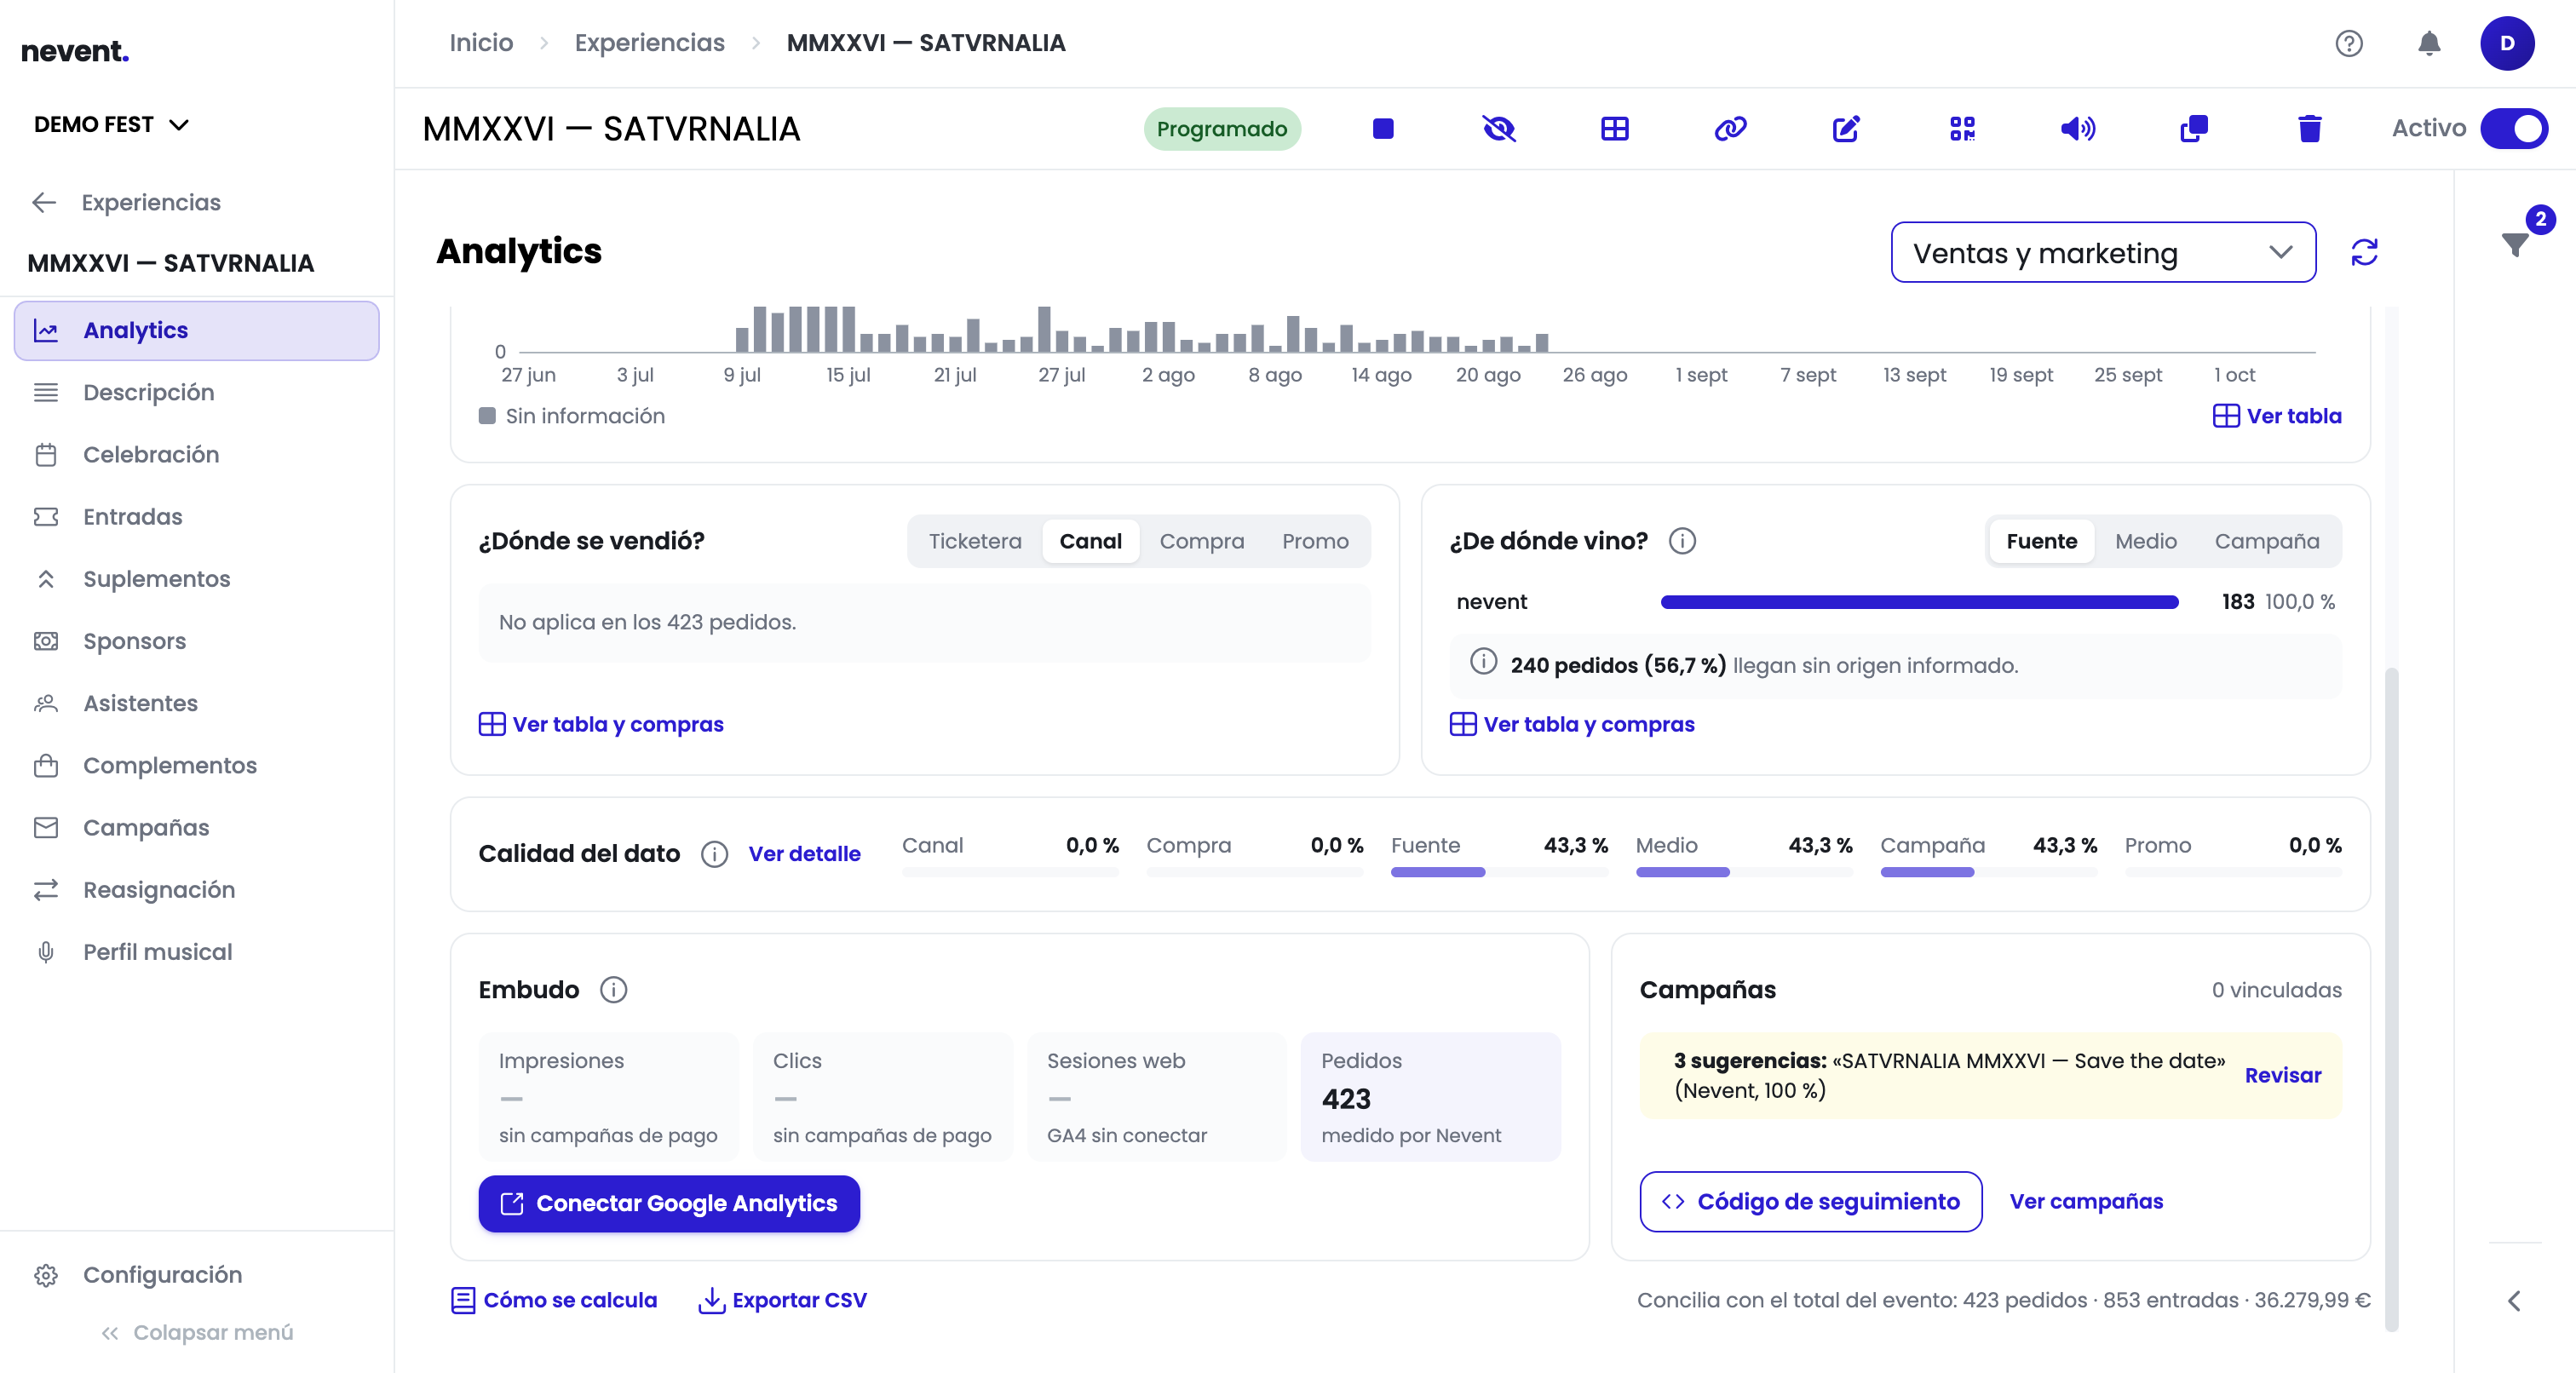
- Where was it sold? splits orders by sales channel. The Ticketing platform, Channel, Purchase and Promo tabs switch the dimension. The Promo tab groups by promotional code.
- Where did it come from? splits orders by marketing source, with the Source, Medium and Campaign tabs.
When a dimension has no data, the block says so explicitly instead of leaving a gap: you will see a notice such as “Does not apply to the N orders” or “N orders arrive with no reported source”.
The Data quality block summarises at a glance how much coverage each dimension has. A coverage of 0% means that dimension is not yet usable for decisions.
Step 4: Drill down with “View table and purchases”
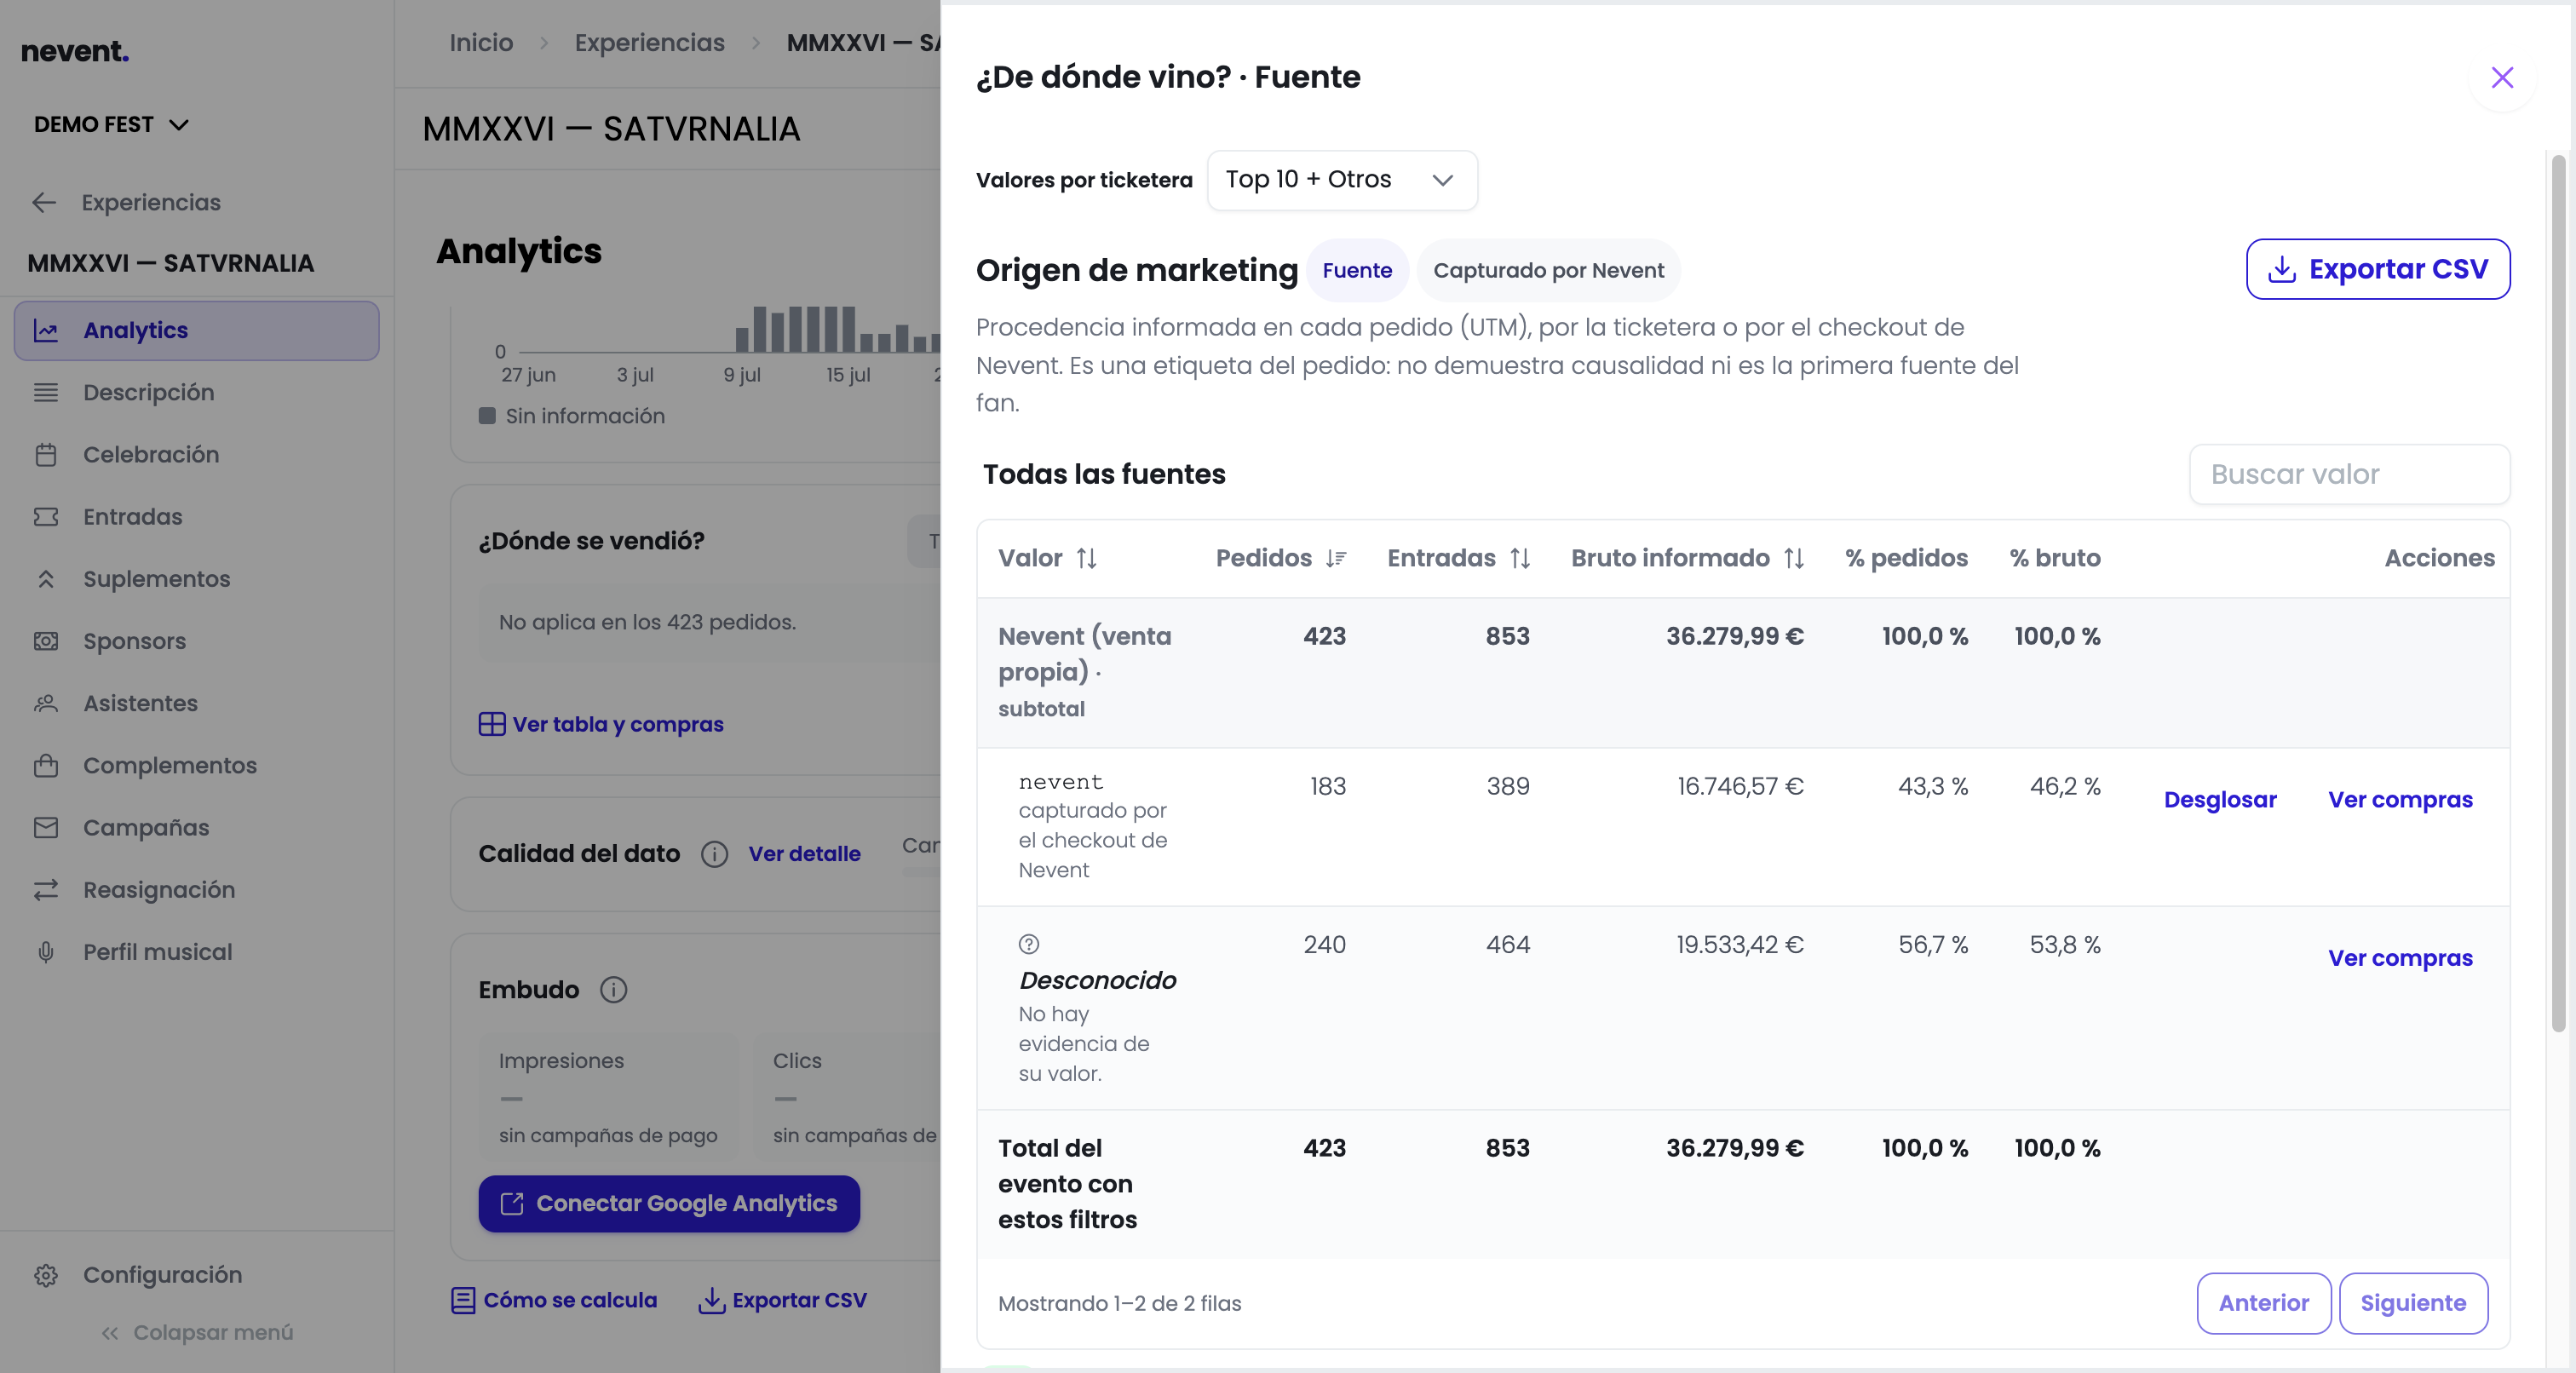
Section titled “Step 4: Drill down with “View table and purchases””Each provenance block has a View table and purchases link that opens a side drawer with the full table: value, orders, tickets, reported gross and the percentage weight of each row.
In that drawer you can search for a specific value, adjust how many values to show per ticketing platform and export to CSV. Orders whose source is unknown are grouped as Unknown, with a note that there is no evidence of their value.
Result
Section titled “Result”You now know how many orders the event generated, how much they billed, which channel they came through and how much of that information is reliable. If source coverage is low, the next step is to improve the tagging of your links before drawing any attribution conclusions.
Next step
Section titled “Next step”- Event and ticket metrics for the full catalogue of what you can measure.
- How tracking and attribution work to understand why some orders have no source.
- Unattributed sales if source coverage is very low.